Guardium Insights 2.5 was released at the end of last year. It is a great new version of an exciting product from the Guardium team at IBM. We got it up and running over the holidays and started playing around with it. This article is a result of one of those experiments: Running a JupyterLabs instance and using it to analyze the data in Guardium Insights.
From Appliances to a Security Data Science Platform
Guardium has traditionally been built around appliances. Appliances are relatively easy to manage and secure, but also lock you into the interfaces that the Guardium developers expose. Guardium Insights, on the other hand, is built on an open platform – Red Hat OpenShift. This gives it a great deal of flexibility and allows you to install and use an ecosystem of components and products that are easily deployed on OpenShift and Kubernetes.
This is a tutorial, so, without further ado, let’s get down to the nuts and bolts of the solution. To complete this tutorial, you’ll need to have Guardium Insights 2.5 installed, an OpenShift CLI Client, and access to the OpenShift web console.
Installing JupyterLabs
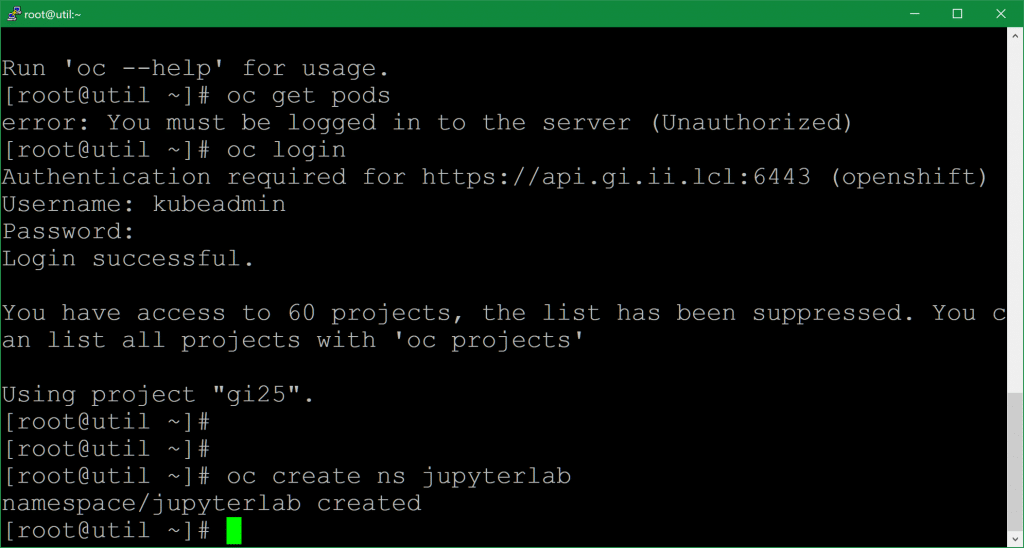
The first step is to install JupyterLabs into an OpenShift namespace. To do that, log into OpenShift and execute:
oc create ns jupyterlab
Next, log into your OpenShift console and find the JupyterLab operator in the OperatorHub:
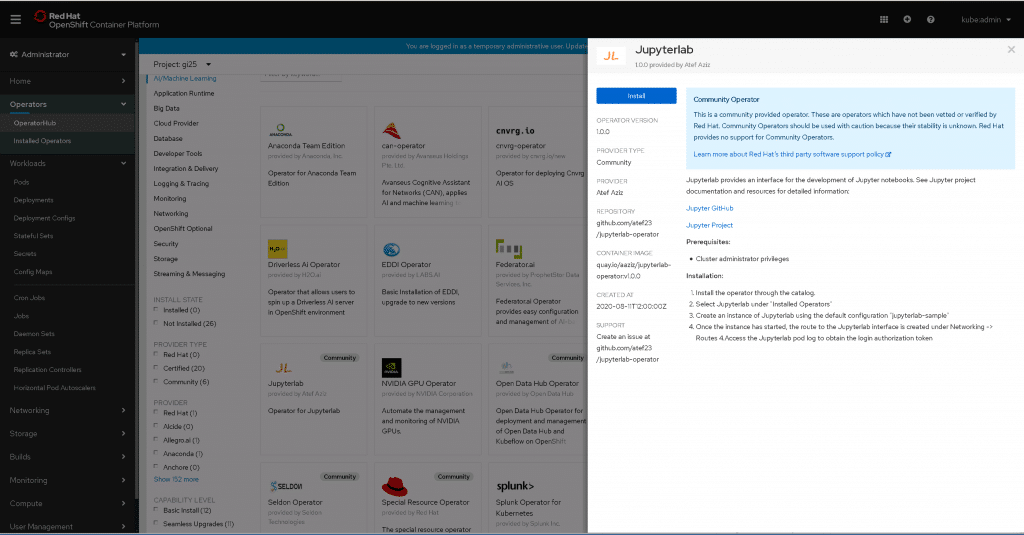
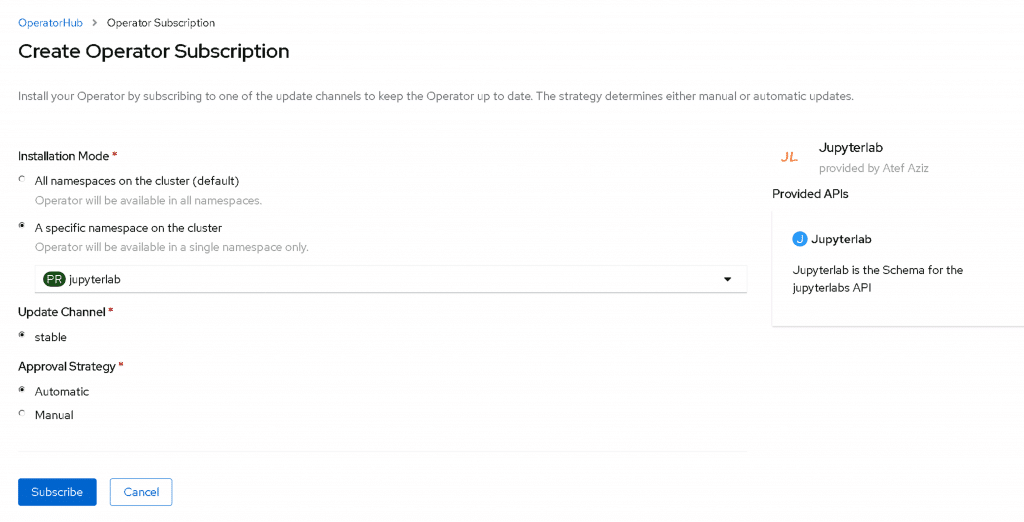
Click Install and select your new namespace from the list:
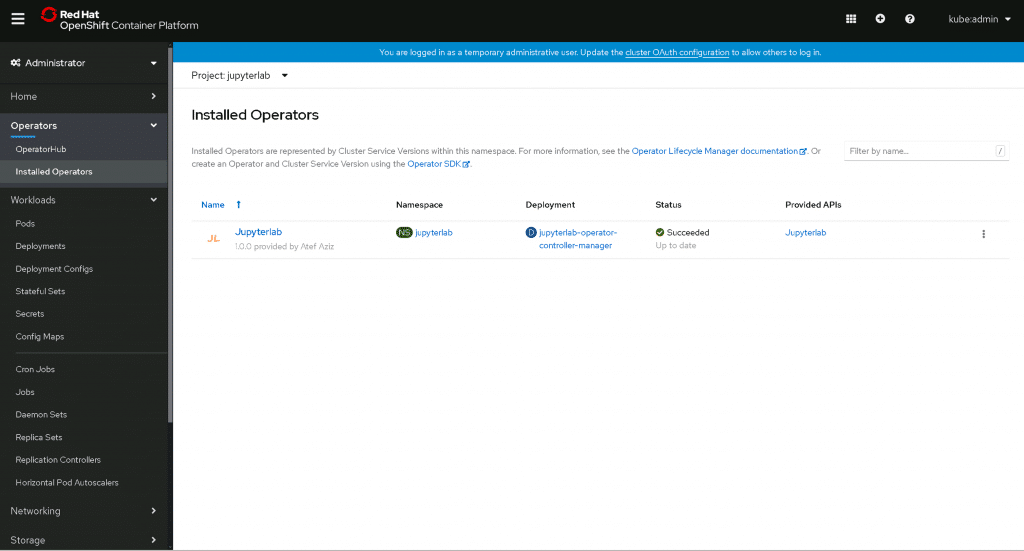
Wait for Installation to succeed:
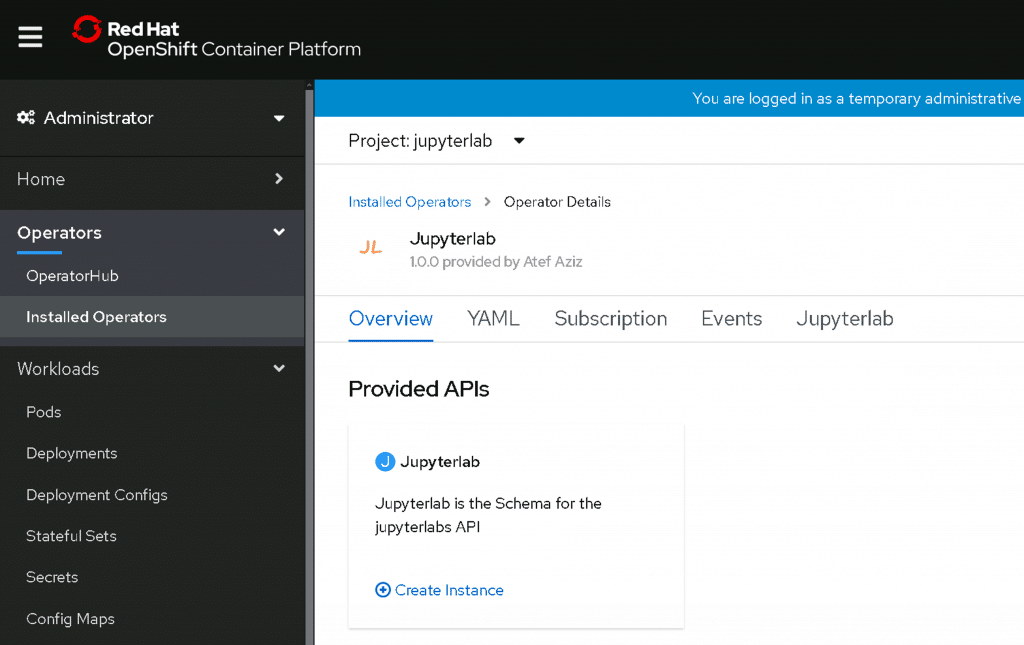
Next, access the operator configuration and navigate to the Jupyterlab tab. From here you can deploy individual JupyterLab instances with the Create Jupyterlab button. This way, you can have multiple people working with JupyterLab without deploying a JupyterHub – although a hub would probably be a good idea once you have more than a few users.
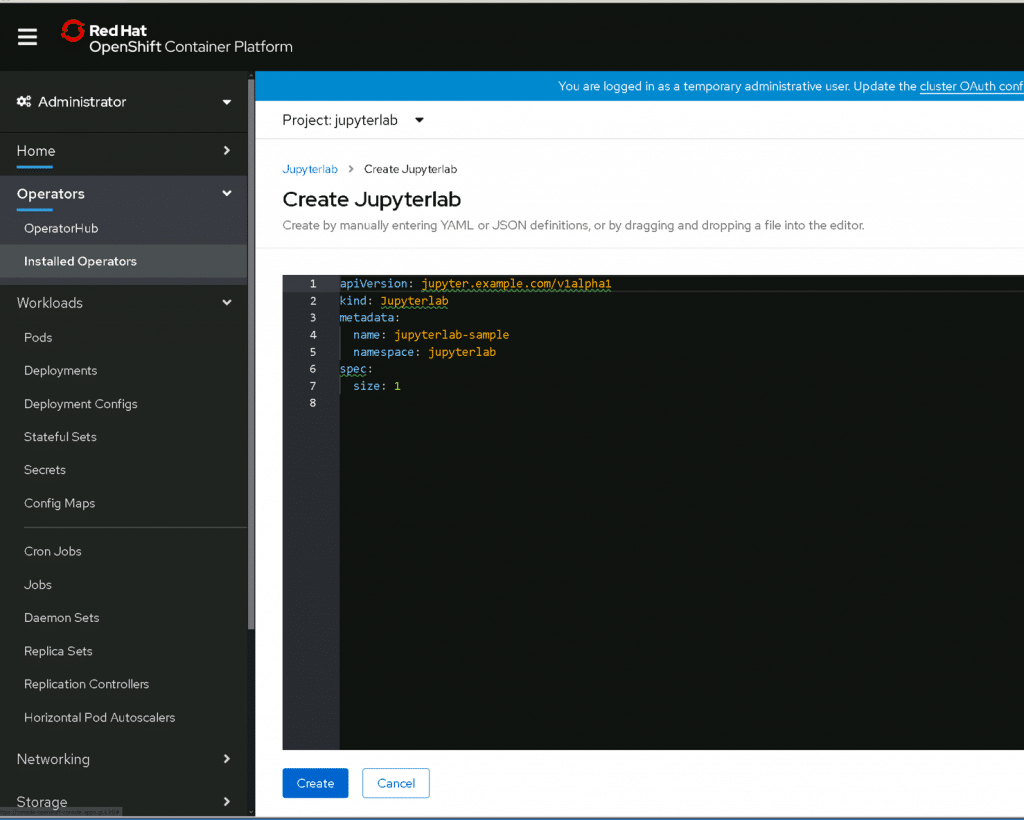
All you really need to do in the yaml configuration is specify a name. We kept the default in this tutorial.
Now we need to wait for the new pods to deploy. You can see that the one for the operator is already running, and it’s creating a new pod for our new JupyterLab instance.
oc project jupyterlab
oc get pods

Here’s what it looks like when it’s done:

While you’re here, let’s install some dependencies on the pod that we’ll need later. Altair is a graphing library for python that allows you to define visualizations declaratively. It, and its sister project Vega, are my preferred tools for quickly building visualizations and exploring data.
oc exec -it jupyterlab-sample-<id> /bin/bash
pip install altair vega_datasets

There’s a problem with bootstrapping dependencies like this, but for this simple example it’s the easiest and quickest way to get the job done. I’ll talk about what the issues are with this in the “Next Steps” section below.
Once that’s complete, you can take a look at the routes in the namespace to find the URL at which you can access the new JupyterLab instance. Save this for later.
oc get routes

With that out of the way, let’s log into JupyterLab. To do that, we need a token to authenticate. You can get that by extracting it from the pod’s logs. I’ve whited out my token, but the screenshot below shows you where you can get yours.
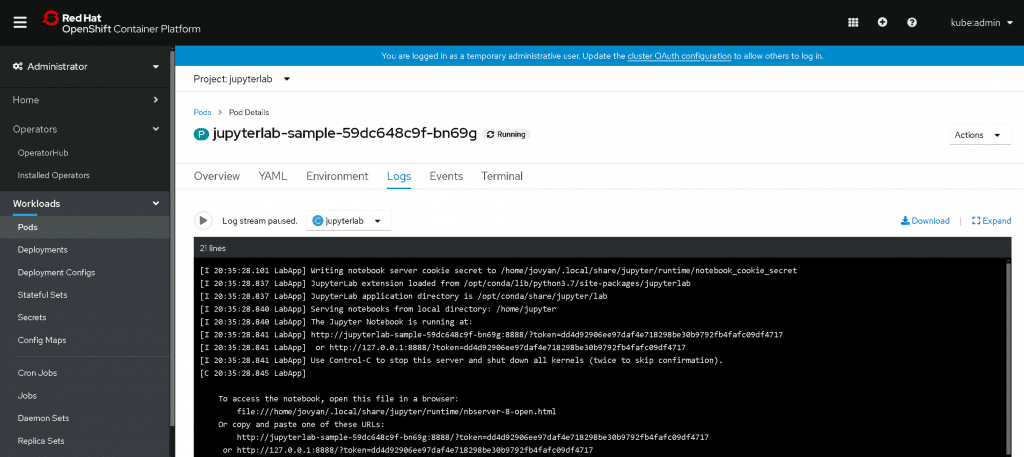
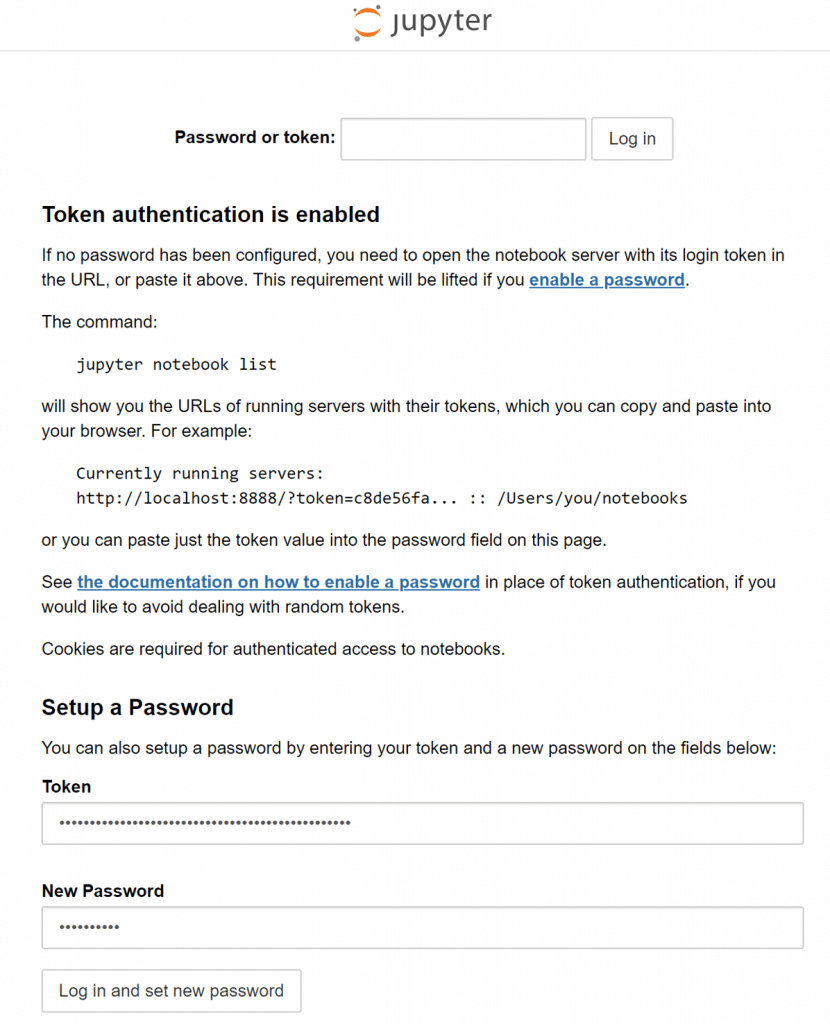
Go to the URL you retrieved from the oc get routes command above and enter your token. Since tokens can be hard to remember, you can also set a new password if you like:
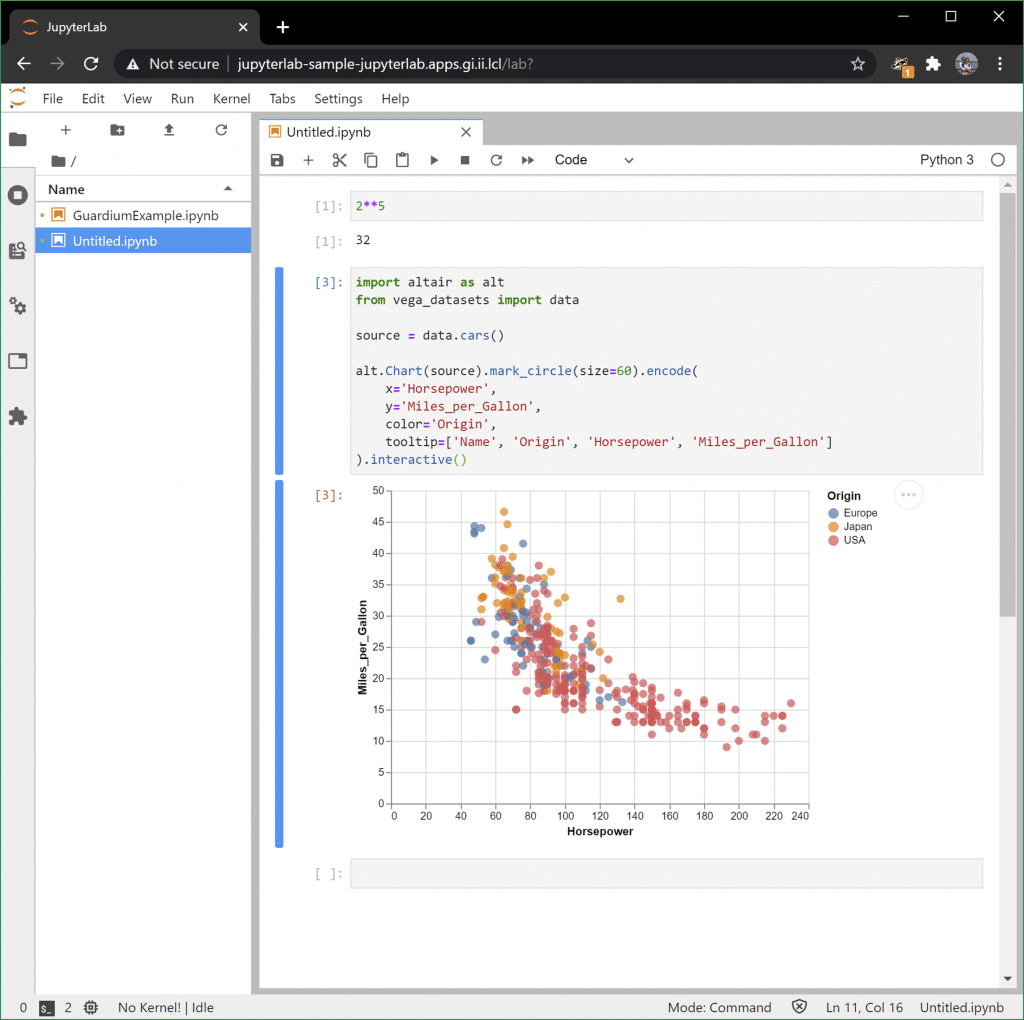
You should be in JupyterLabs! Good work. Run some python commands or play around with some Altair examples to get the hang of things:
Visualizing Guardium Insights Data
To get Guardium data into Jupyter, there are a few options. One easy one is via the API. To use the API, you’ll need an API key. The product documentation has those steps outlined here:
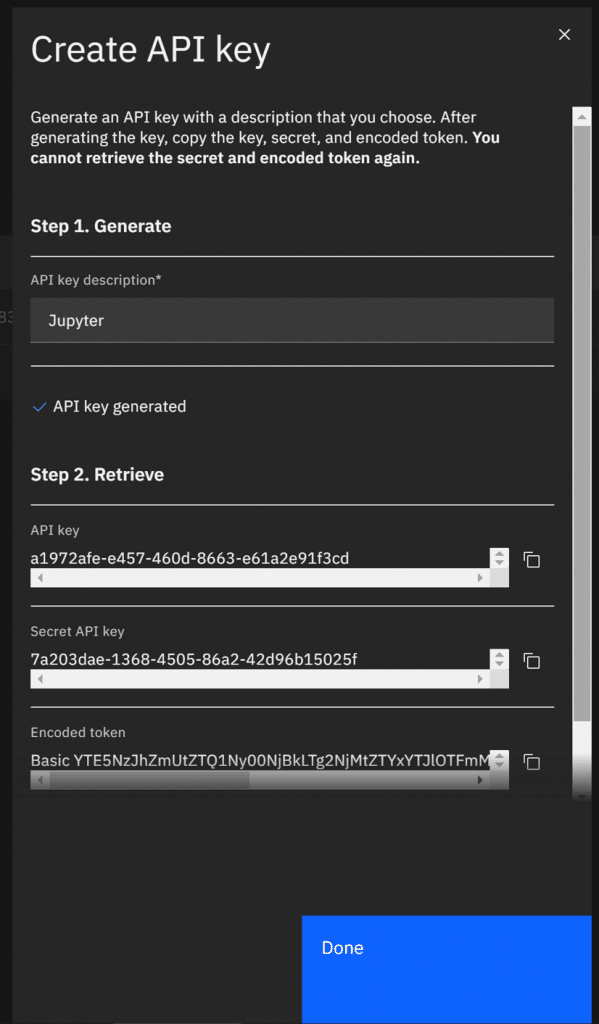
Once you have a key, you can use Python to retrieve data from Guardium using HTTP requests.
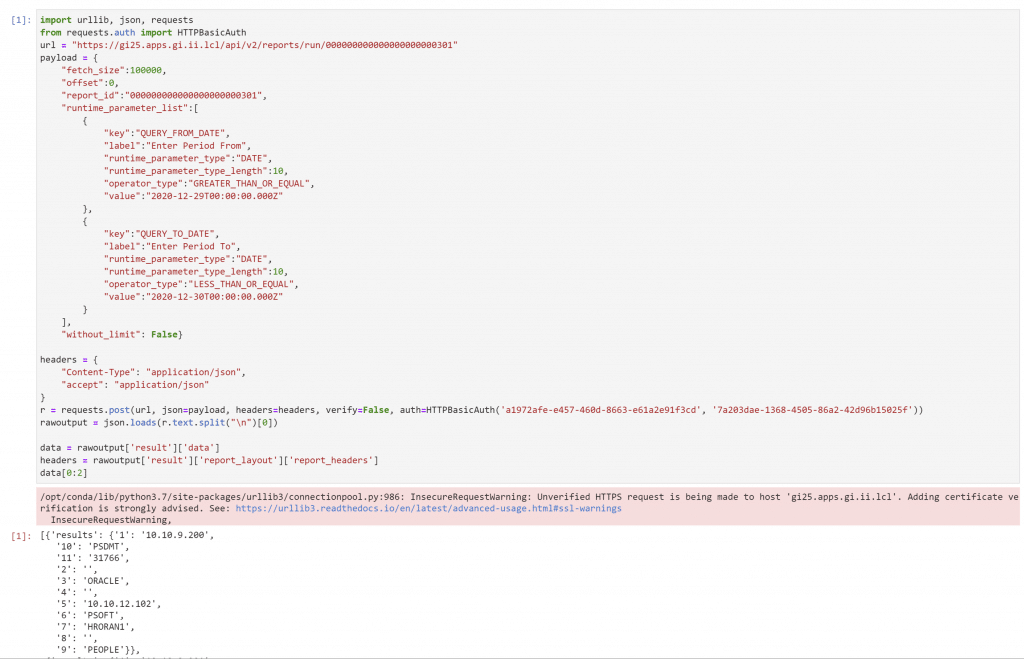
If that looks overwhelming, don’t worry, there are resources to help! The first is the API documentation built into Guardium insights in the Swagger interface at the /docs/v2 URI.
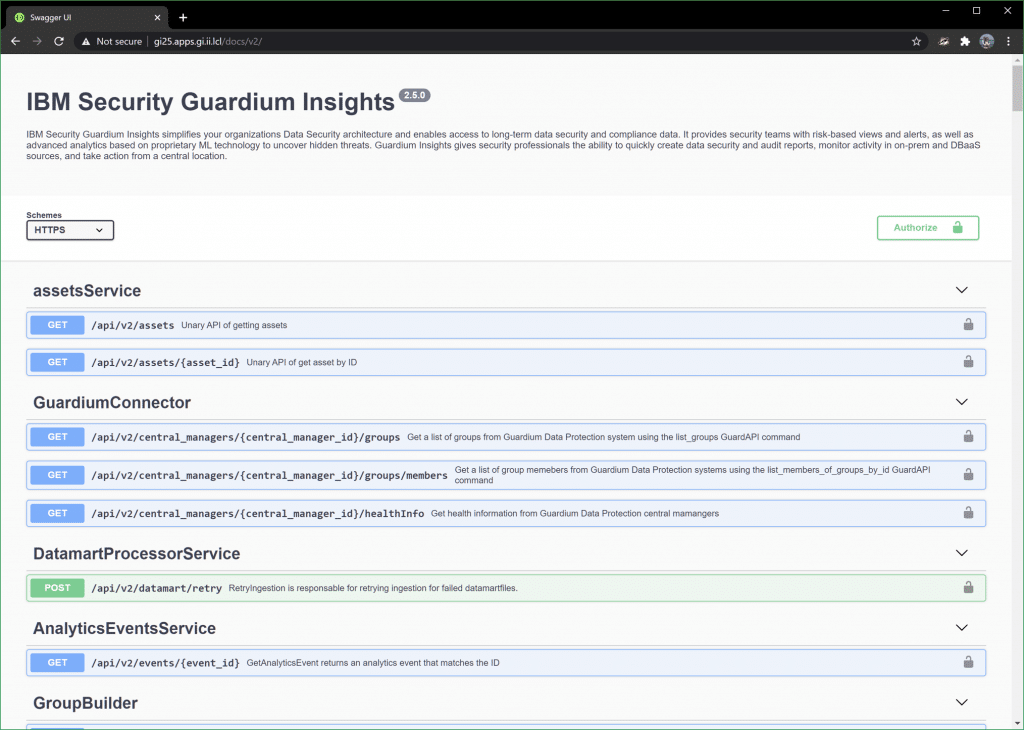
You can use this to execute API calls. To get audit data that Guardium Insights is capturing, look under the ReportsRunner header:
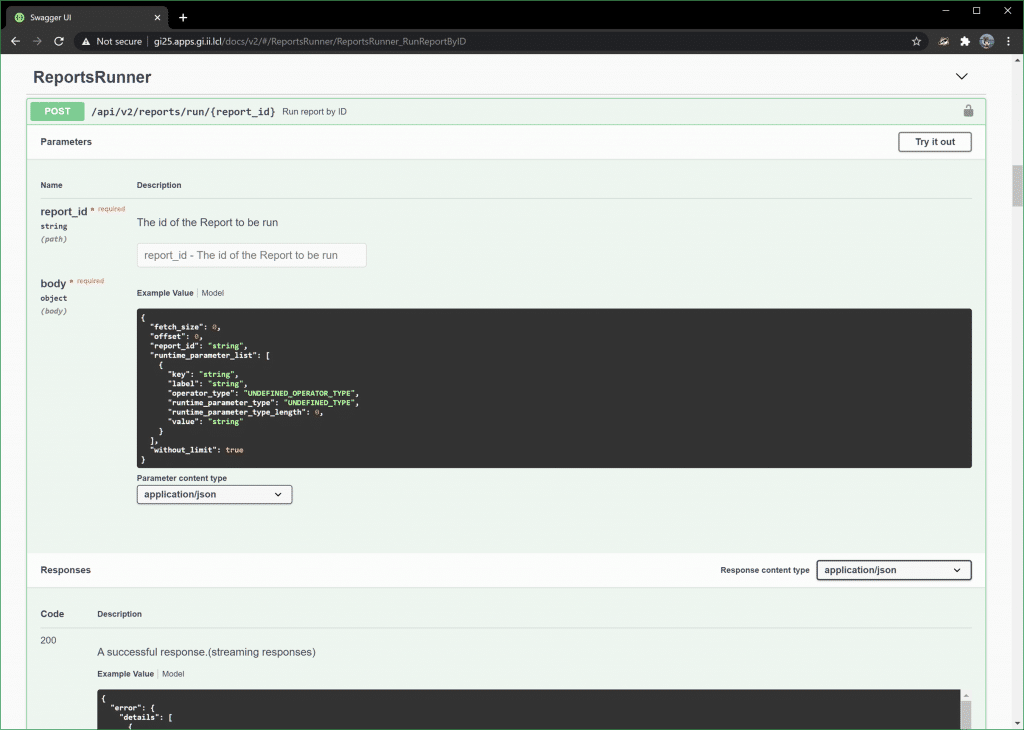
Another resource is Guardium Insights itself. It uses the same API! So, if you want to see an example, just run a report and use Chrome or Firefox development tools to capture the XHR requests on the back end. All you’re doing is replicating those. Note that the URI endpoint we’ll use is slightly different. They use one that requires an XSRF token in a cookie, whereas our endpoint doesn’t.
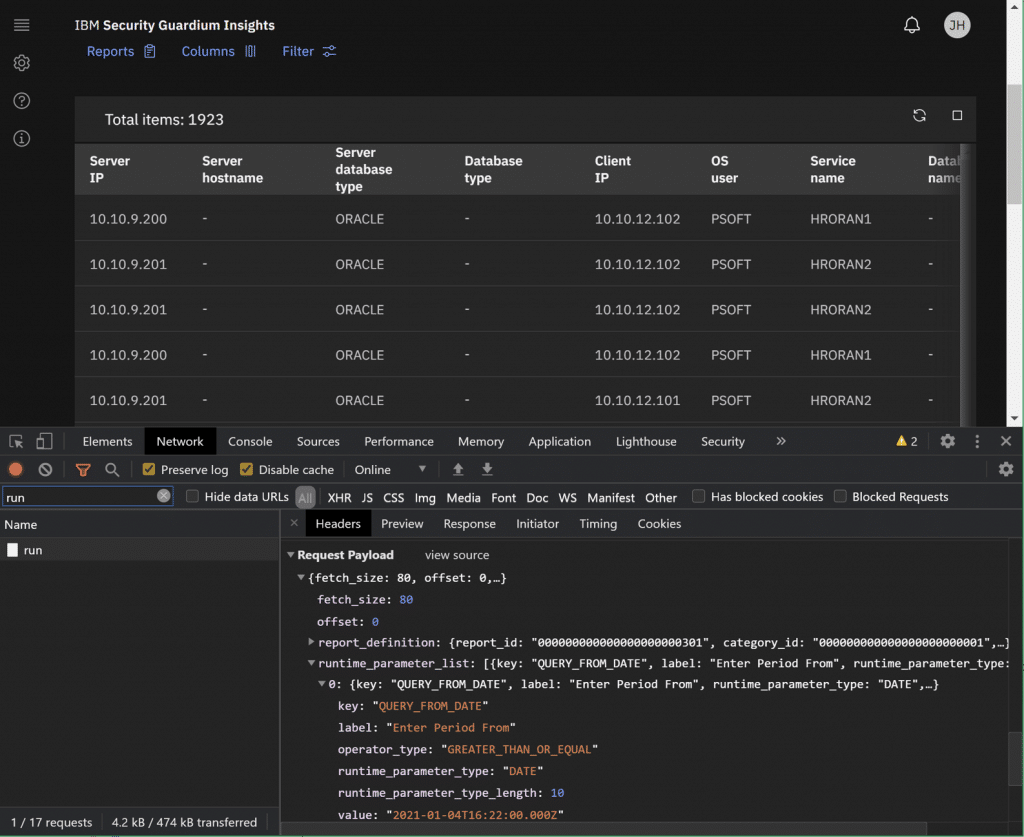
Finally, you can use my notebook as a template! You can download it (with my API token removed) on my GitHub here and use some of the cells as a template.
What follows is an explanation about what’s in the rest of the notebook that isn’t part of the Guardium Insights report API.
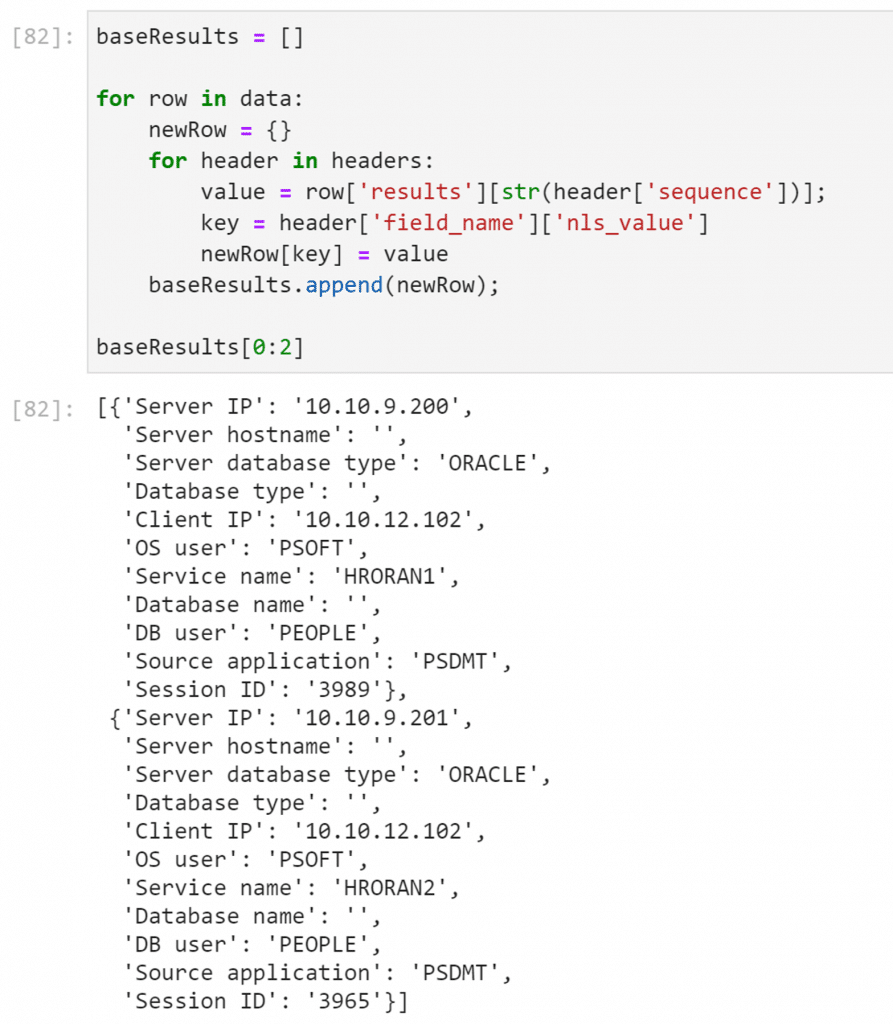
This section of the notebook converts the data retrieved from Guardium Insights into a list of dictionaries, which is how I find it easiest to build a pandas dataframe (coming later). That said, there are other options for formatting the data into a dataframe, so you might prefer a different method.
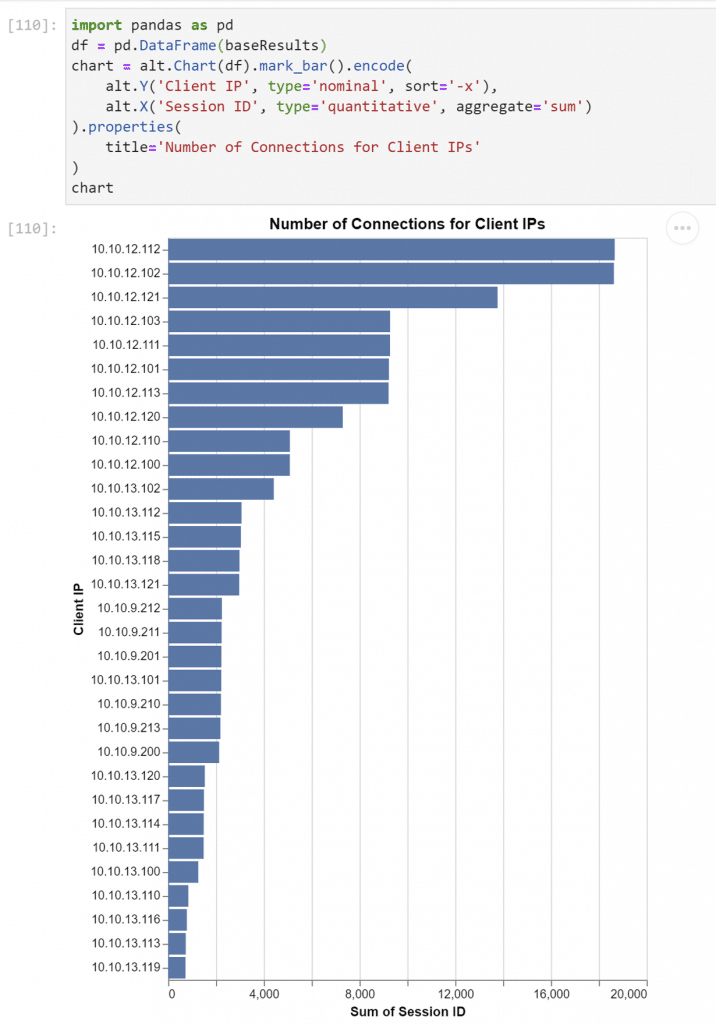
Here’s dataframe creation (df) and some basic declarative charting with Altair:
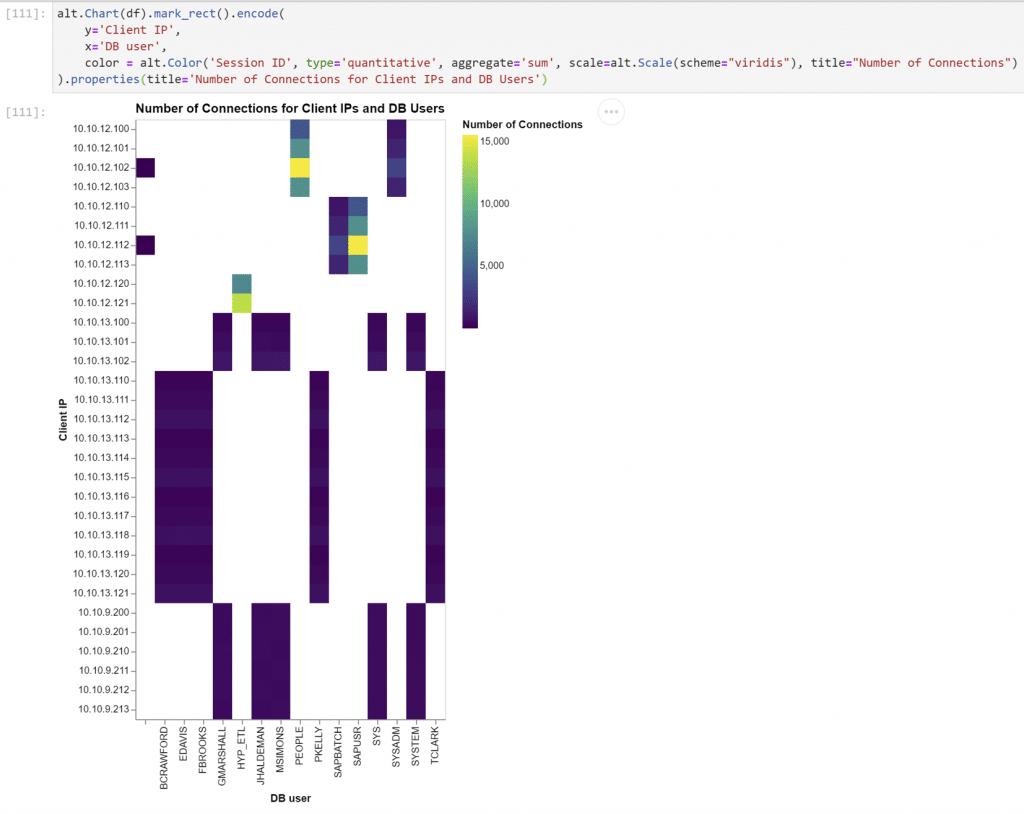
Another chart – this one a heat map. Altair makes it easy to template and adjust:
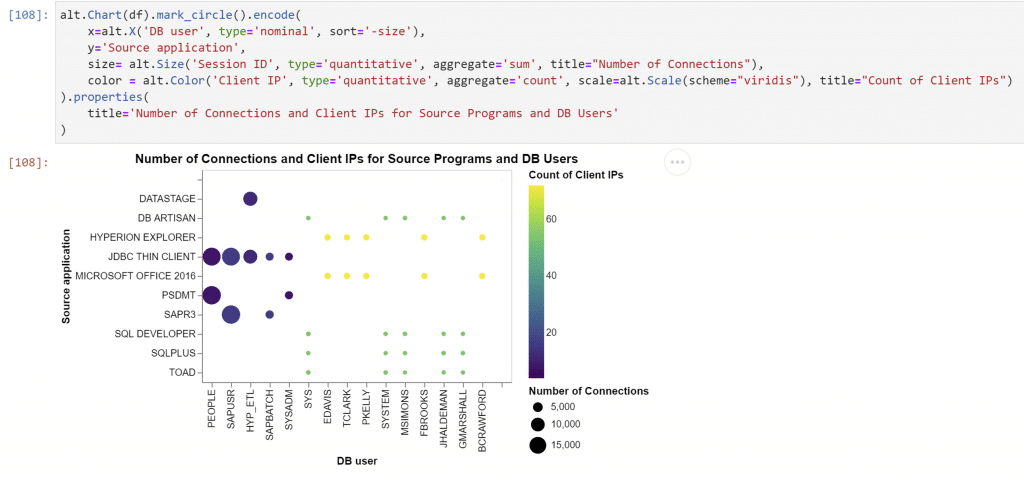
And here’s a bubble chart which gives us an additional dimension to display data:
Next Steps
So, now you have JupyterLab and a mechanism to extract data out of Guardium Insights. From here, you can adapt some more Altair examples and create different kinds of visualizations on other data elements and reports. You could also add other components to the stack and look at other kinds of analysis and data mining. You could even add a JupyterHub to help manage users in the Jupyter environment, facilitate sharing, and enable self-service.
There are some things you should know about this deployment. We installed some dependencies with pip in an earlier step, but the problem is that containers are ephemeral. That means those dependencies won’t be there if the pod restarts. There are some options for that ,like extending the container image or adding lifecycle hooks, but deploying a full-blown JupyterHub using helm may also provide more persistent storage options to help make it all formal.
Finally, all these examples showed either websites without TLS or access to an API that required trusting its self-signed certificates. That would probably have to be fixed in a situation outside of a POC.
Conclusion
JupyterLab, and notebook frameworks like it, provide an extremely powerful way to understand your data and share your results with others. They are well-suited to the task of helping analyze security data. This tutorial also demonstrates one of the things that makes Guardium Insights exciting – the possibilities and flexibility of the OpenShift platform that Guardium Insights is deployed on, and the design of Guardium Insights to fit into that platform and interoperate with other components. Hopefully, this tutorial gave you a taste of that. It’s likely your requirements for the analysis of your audit data are constantly changing. The good news is that the platform will support you in those changing requirements. With Guardium Insights, you’ll have the flexibility to get the most out of your security investments.


